Status pages
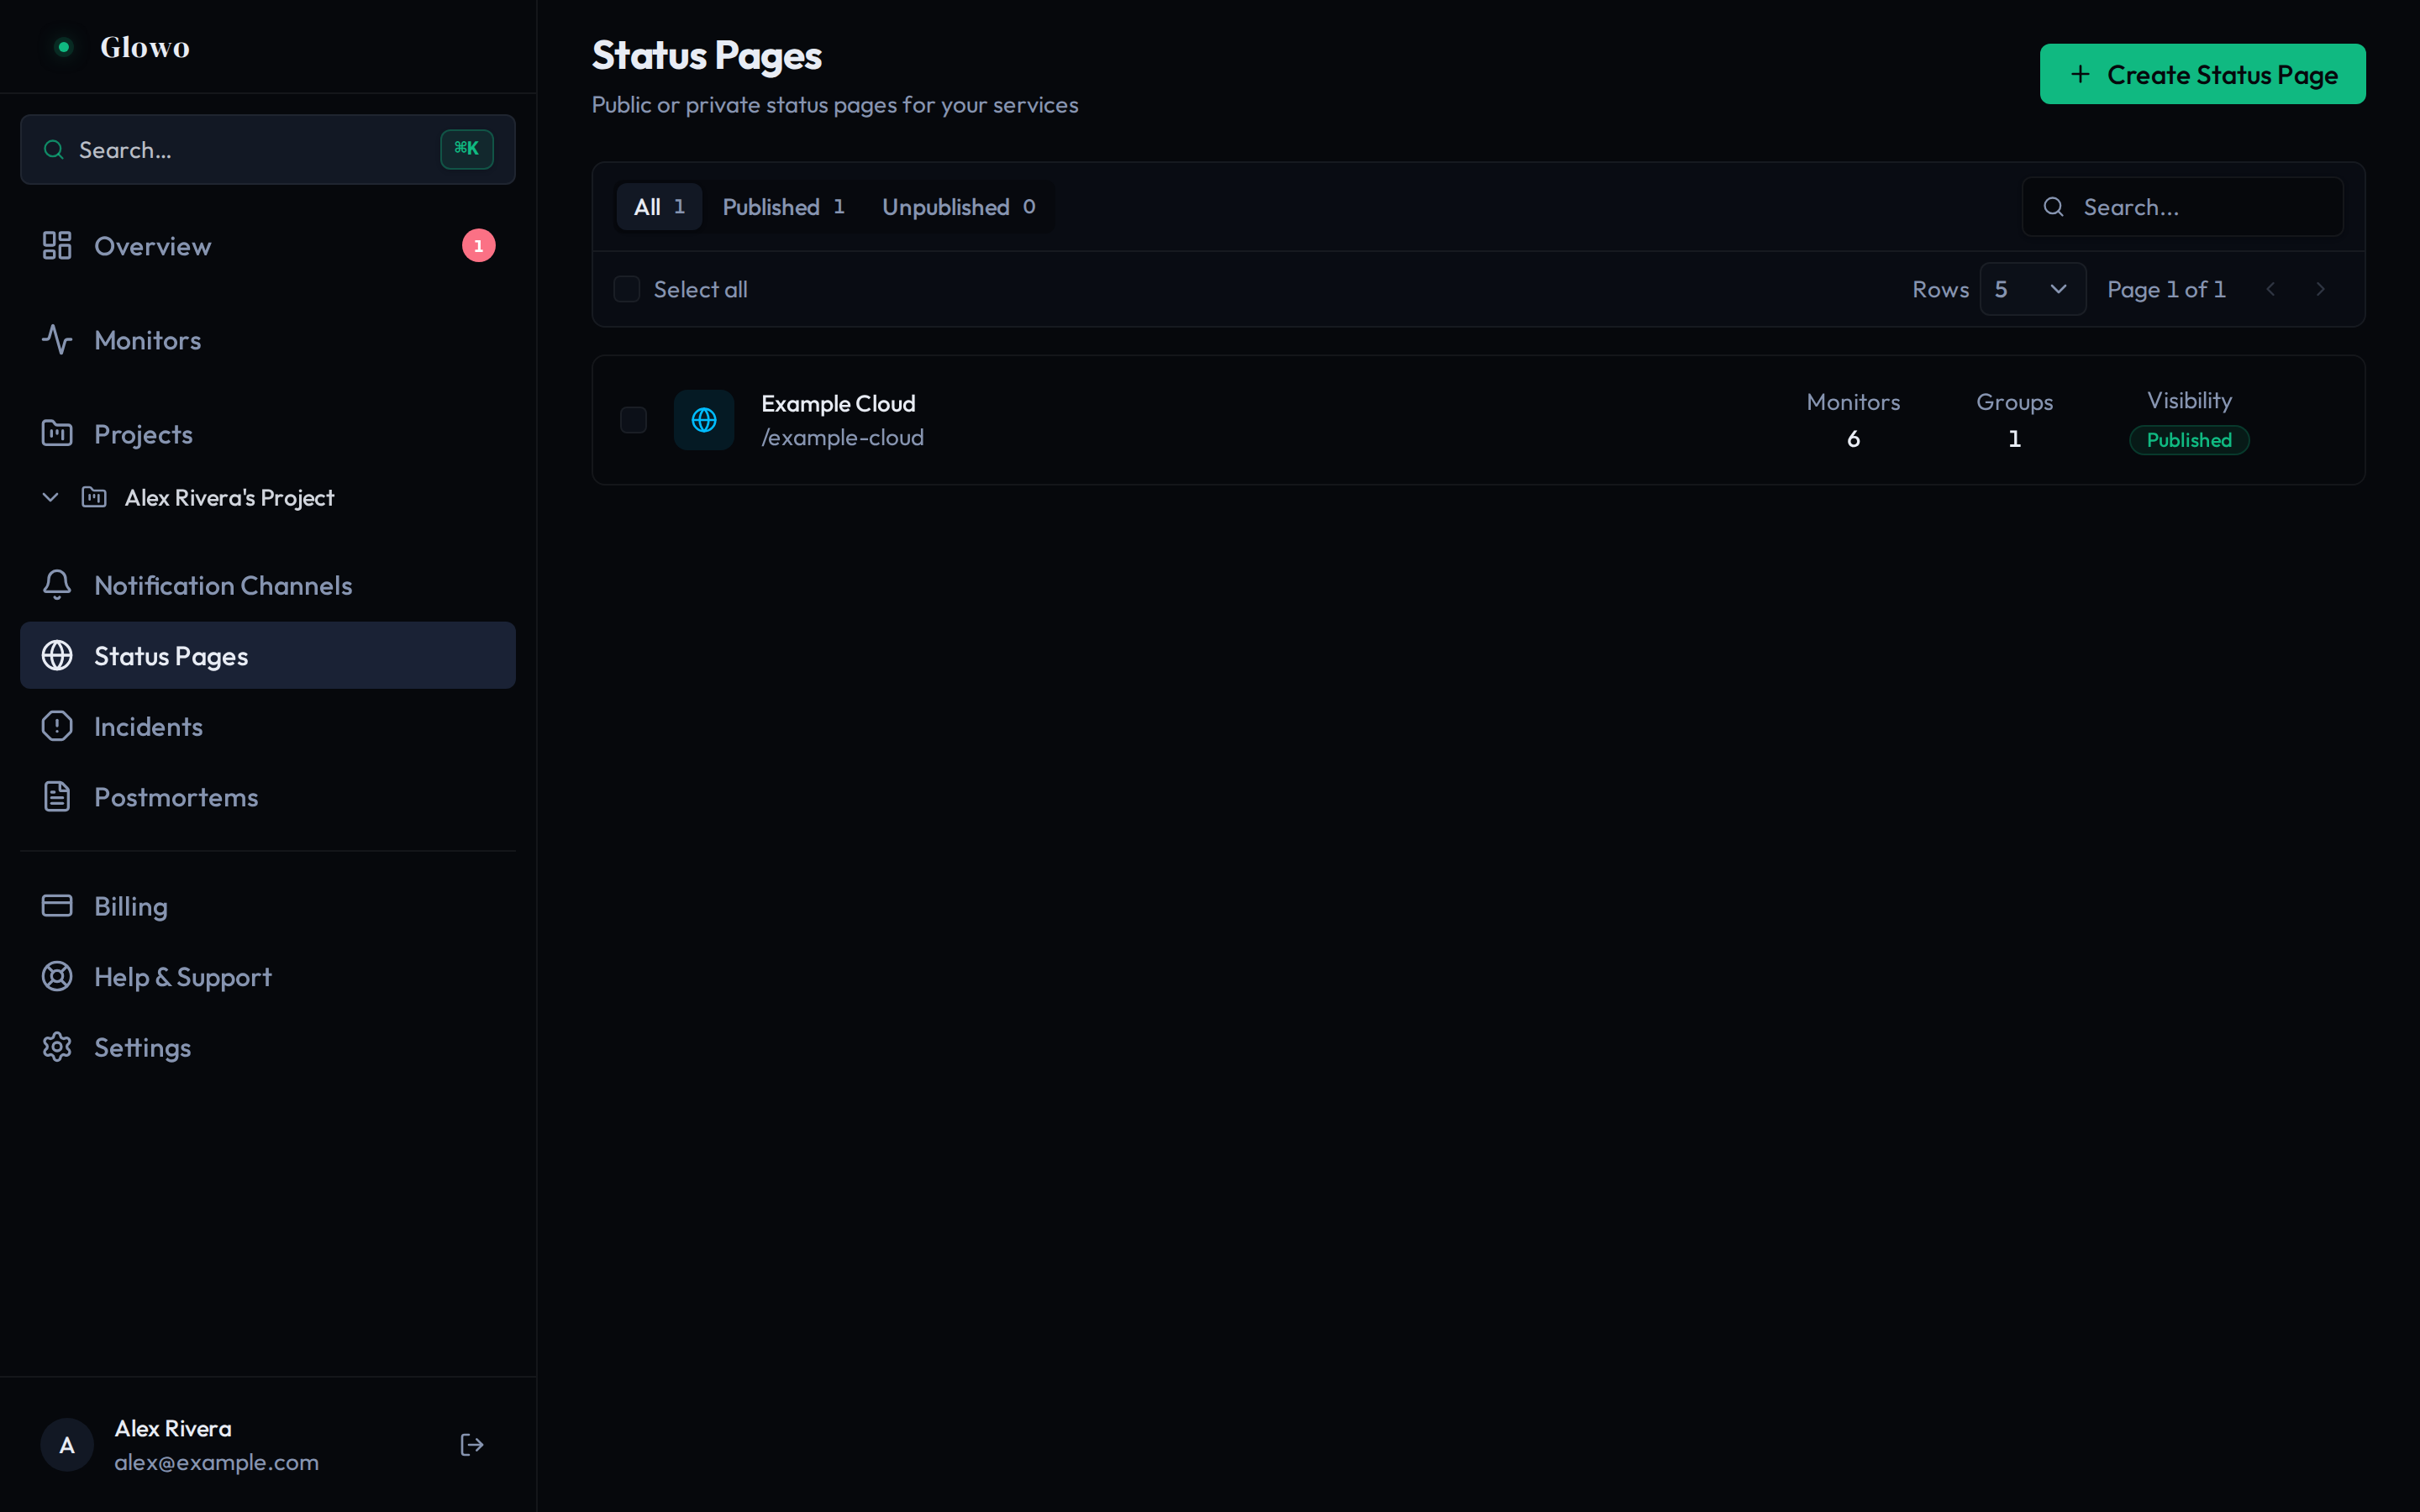
A public page that tells your users what is working, what is not, and what you are doing about it.
A status page turns “is it just me?” into an answer, and takes the pressure off your support inbox during an outage.
Each page is built from components — monitors you choose to expose publicly — plus incidents you publish and maintenance windows you schedule.
What a page shows
- Overall system status.
- Each component and its current state.
- 90 days of uptime history per component.
- Active and recent incidents, with their update timeline.
- Scheduled and in-progress maintenance.
Component statuses
| Status | Meaning |
|---|---|
OPERATIONAL |
Working normally |
DEGRADED_PERFORMANCE |
Working, but slow or impaired |
PARTIAL_OUTAGE |
Some users or some functionality affected |
MAJOR_OUTAGE |
Down |
UNDER_MAINTENANCE |
Inside a maintenance window |
These are derived from the underlying monitor, and can be overridden during an incident when the human picture differs from what a probe can see.
Getting one live
Create the page
Give it a name and a slug. It starts unpublished.
Add components
Choose which monitors to expose. Not every monitor belongs on a public page — see Components and groups.
Make it yours
Pick a template and colours, add a logo and favicon.
Publish it
Publishing makes the page reachable. Until then, share it with a preview link.
Put it on your own domain
Optional but worth doing — see Custom domains.
Choose components deliberately
The most common mistake is exposing every monitor. A public page listing your internal queue workers and staging database tells your users nothing useful and tells everyone else about your architecture.
Expose what a customer can perceive: the app, the API, sign-in, uploads. Keep the internals on the dashboard where they belong.