Getting started
From signing up to a working monitor with alerts and a public status page, in about ten minutes.
This walks through the whole loop once: watch something, get told when it breaks, and show your users. Roughly ten minutes.
1. Create your workspace
Sign up and you get a workspace — the container for your monitors, status pages, channels and billing. One is usually enough; use projects to organise inside it.
2. Create your first monitor
Start with the thing your users would notice first — your site or your API.
Pick the type
Choose HTTP(S) and enter the URL. A health endpoint that touches your database is a much better target than your homepage: it fails when your service is genuinely broken, not just when the CDN hiccups.
Set the interval
60 seconds is a sensible default. Faster intervals detect sooner and cost more checks; see Plans and limits for what your plan allows.
Leave the confirmation defaults alone
Two failures to go down, two successes to recover, and a 30-second floor on how long the failure must last. These exist so a single dropped packet does not page you — see Confirmations and flapping.
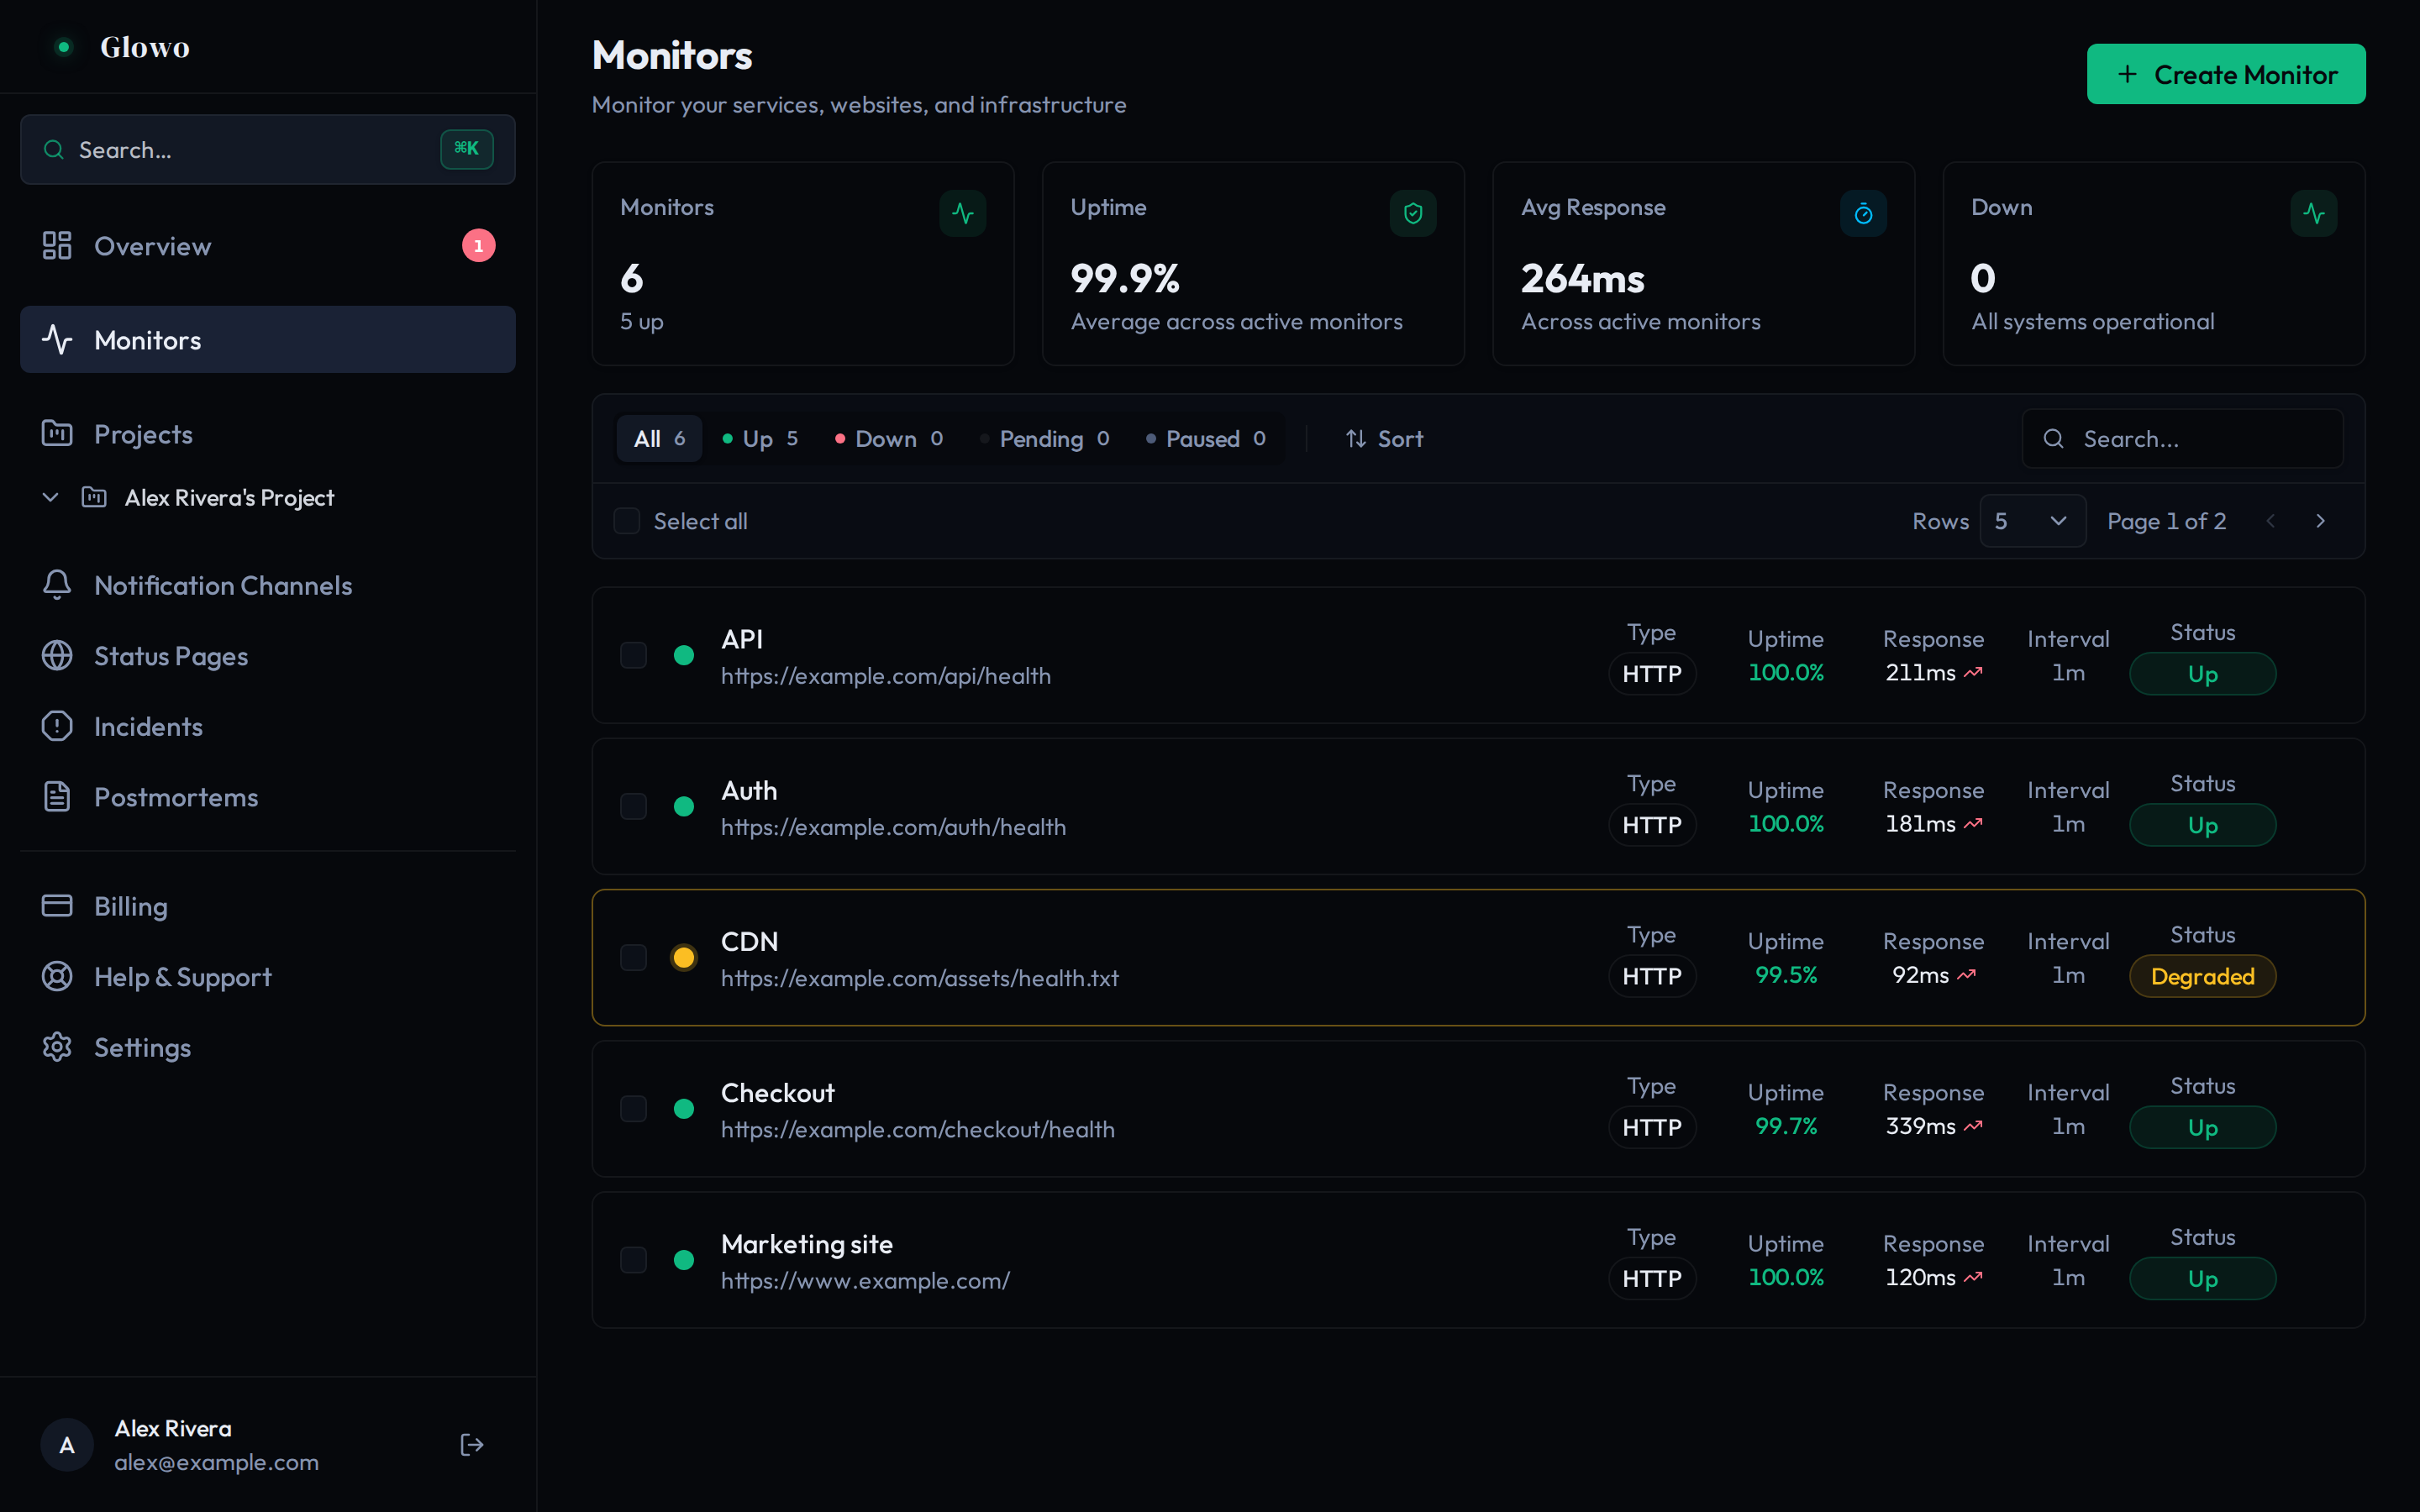
Save and watch
The monitor starts PENDING and moves to UP after its first check.
3. Make it check something real
A 200 response does not mean your service works. Add an assertion so the check fails when the service fails:
| Field | Value |
|---|---|
| source | json_body |
| property | status |
| comparison | equals |
| target | ok |
| severity | fail |
This is the step most people skip, and the one that decides whether your monitoring is worth having.
4. Set up alerts
A monitor with no channel attached tells nobody anything.
Subscribe to both DOWN and UP
Subscribing only to MONITOR_DOWN means nobody ever learns the incident
ended. This is the most common mistake on this page.
Attach it to the monitor
Either directly, or — better — scope the channel to a project so monitors added later are covered automatically.
Send a test
Use the Test action. A typo’d webhook URL is completely silent until your first real outage.
5. Publish a status page
Create the page
Give it a name and a slug.
Add components
Expose only what a customer can perceive, named the way they would name it —
“API”, not prod-api-lb-health. See
Components and groups.
Publish
Until then, share it with a preview link.
Then tell people it exists — footer, help centre, support auto-responder. A status page nobody knows about does not reduce support load.
6. Watch your cron jobs too
Scheduled work fails silently, because there is nothing to poll. A push monitor inverts the check — your job calls Glowo, and you are alerted when it does not:
backup.sh && curl -fsS -m 10 -X POST https://api.glowo.dev/push/<your-token>The && matters. A heartbeat that fires regardless of the exit code reports
success while the job is failing.
Where to go next
Monitor types
TCP, ping, DNS, WebSocket, gRPC and heartbeat checks.
Tune out false alarms
The settings that decide when a failure becomes an alert.
Check from more regions
Tell a real outage apart from one bad network path.
Connect an AI agent
Let Claude or Cursor investigate and operate your monitoring.
A checklist worth doing once
- Every critical monitor has an assertion, not just a status check.
- Every channel is subscribed to
MONITOR_UPas well asMONITOR_DOWN. - You have sent a test through every channel.
- Critical monitors check from more than one region.
- Scheduled jobs have push monitors with a sensible grace period.
- Your status page is linked from somewhere users will find it.