Uptime reports and history
Heartbeats, hourly statistics, and downloadable SLA reports in JSON or CSV.
Every check Glowo runs is kept as a heartbeat: its result, latency, region, and — on failure — the error code and message.
Heartbeats
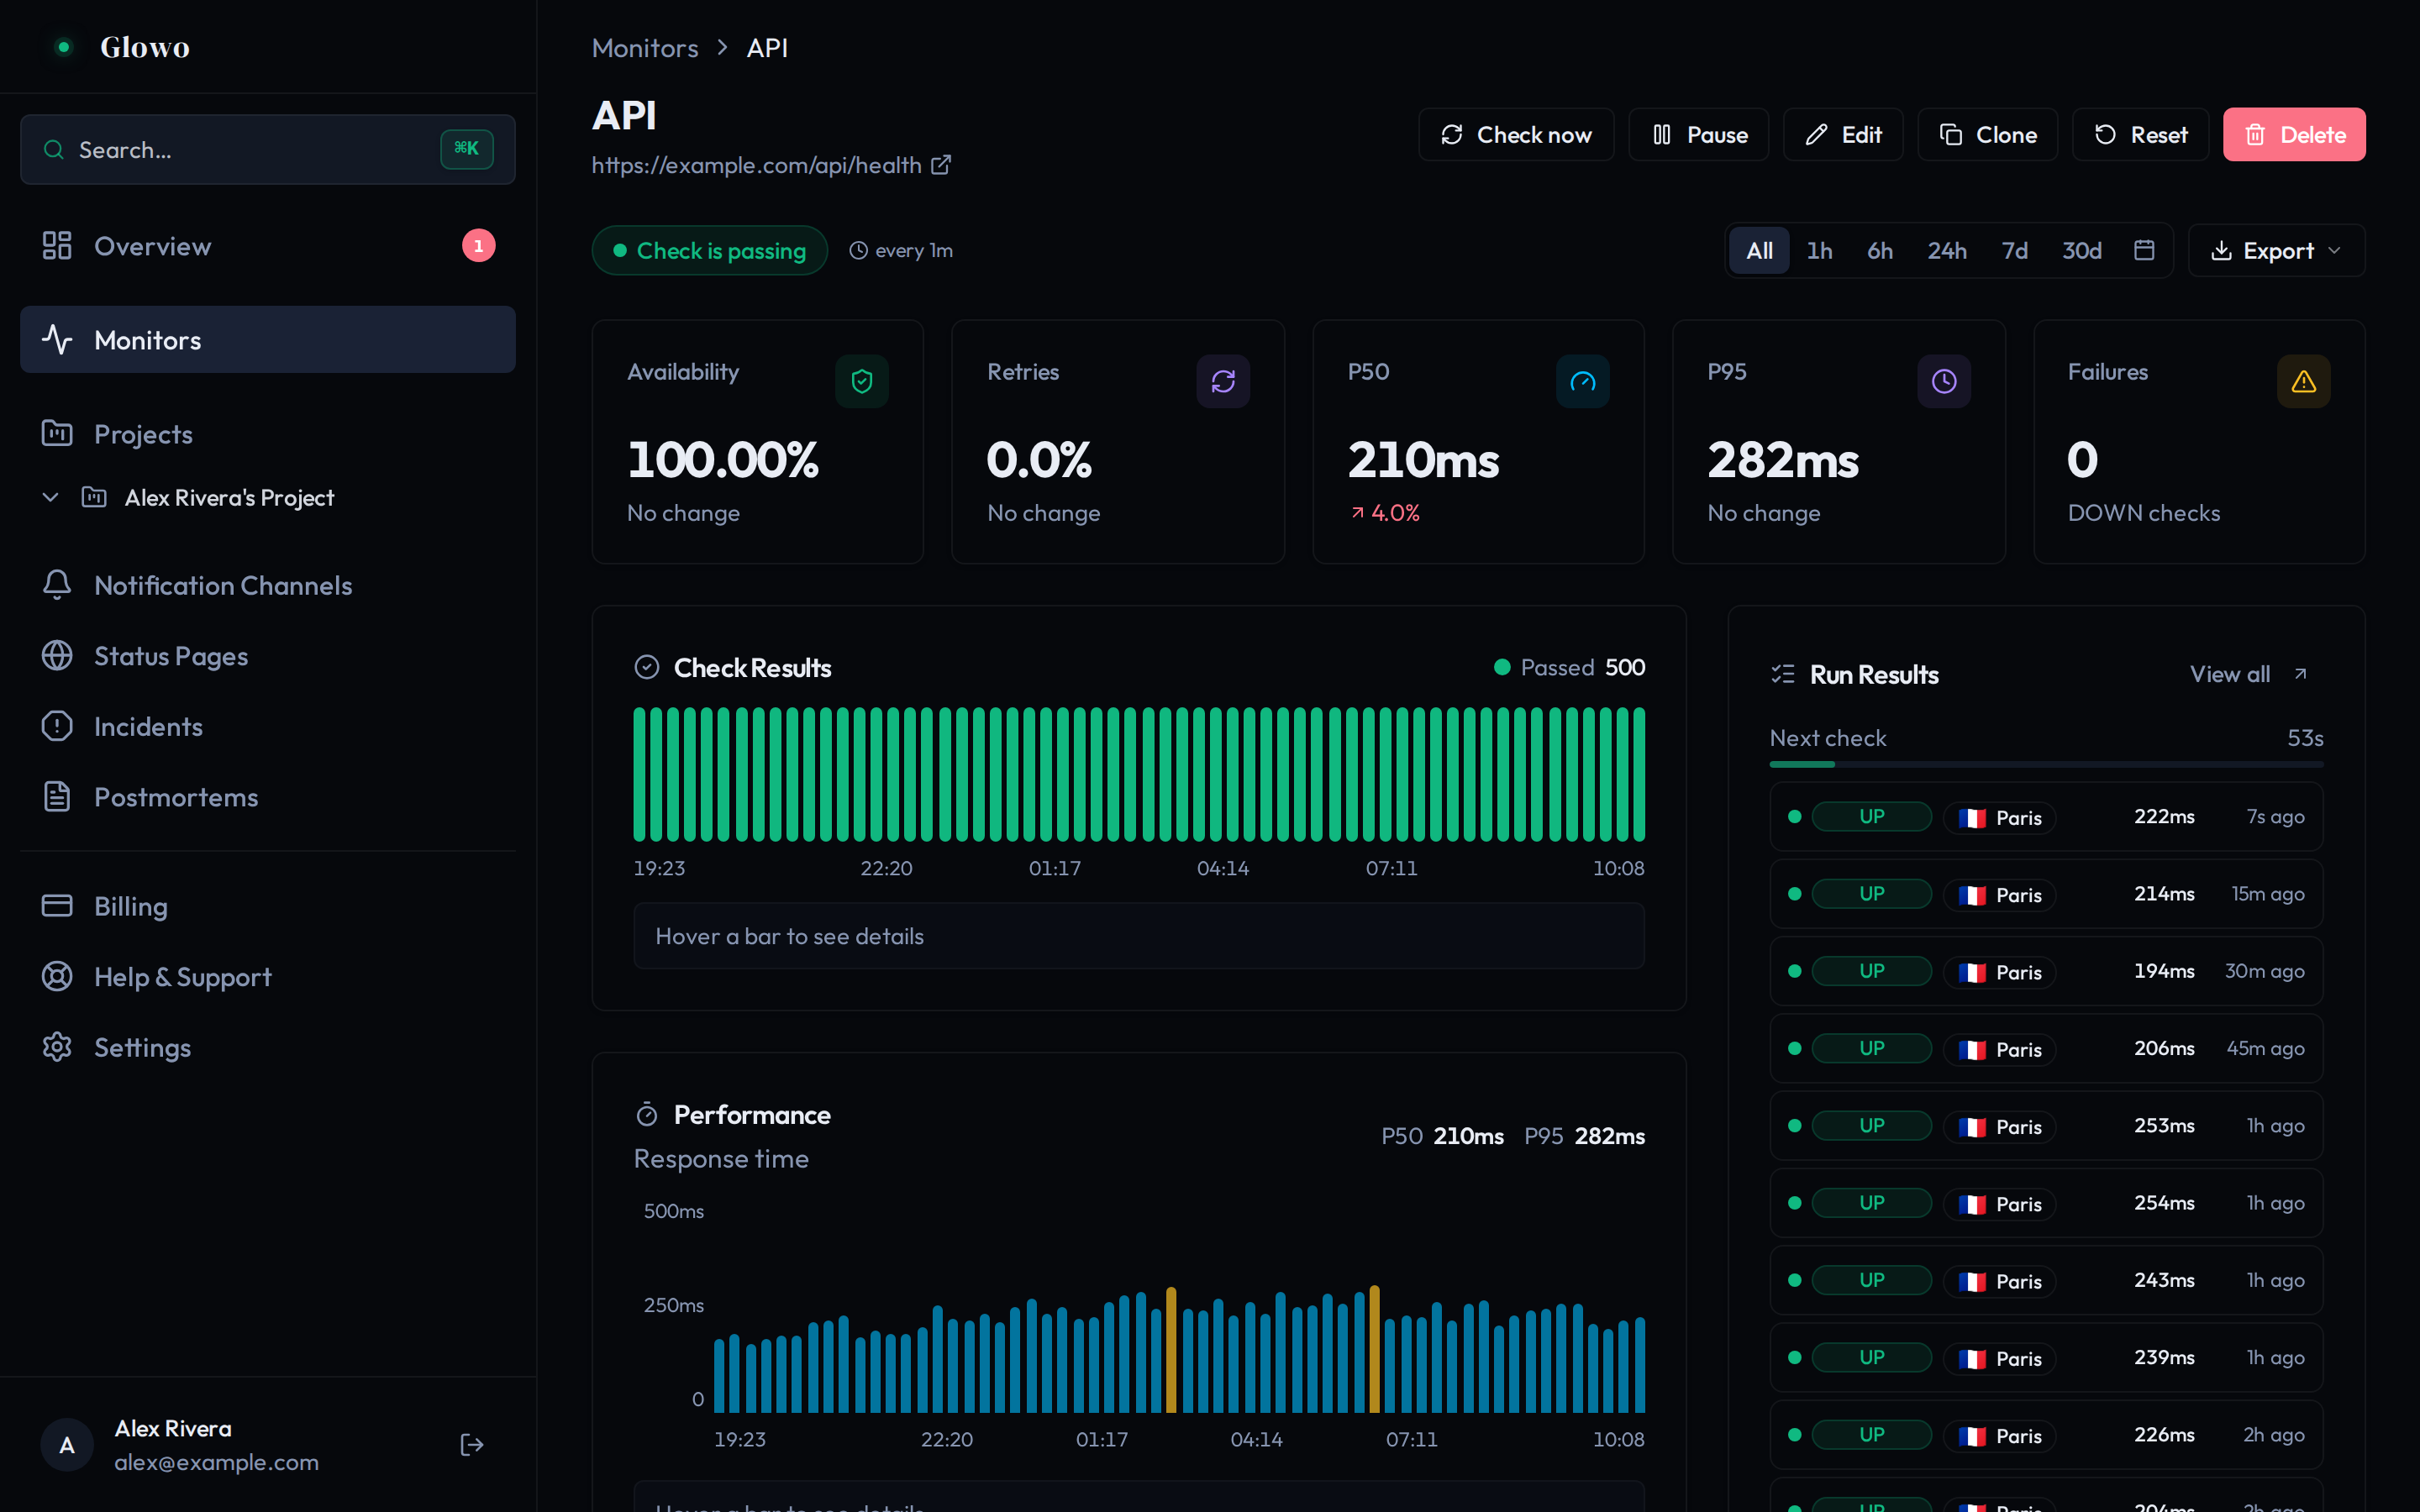
The monitor page shows the recent heartbeat timeline. Opening a single heartbeat gives the full detail, including the timing breakdown and the response metadata captured at the time.
GET /monitors/<monitor-id>/heartbeats
GET /monitors/<monitor-id>/heartbeats/<heartbeat-id>
For multi-region monitors each region records its own heartbeat, which is how you tell “the service is down” from “one region cannot reach it”.
Hourly statistics
GET /monitors/<monitor-id>/hourly-statsHeartbeats rolled up per hour. This is what the dashboard’s longer-range charts draw from — use it when you want a trend rather than individual checks.
SLA reports
GET /monitors/<monitor-id>/report
GET /monitors/<monitor-id>/report?format=csv
Returns uptime percentage, incident count, average latency, paused time and
per-day statistics. format=csv returns the same data as a download, for
attaching to a customer SLA review or pasting into a spreadsheet.
Paused time is reported separately and excluded from uptime, so pausing a monitor for planned work does not quietly inflate your numbers — the gap stays visible and honest.
Retention
How long heartbeats are kept depends on your plan:
| Plan | Retention |
|---|---|
| Free | 30 days |
| Pro | 90 days |
| Business | 365 days |
Hourly statistics let you see trends across a longer window than raw heartbeats would practically allow. If you need history beyond your plan’s retention, export the report periodically.
Clearing history
DELETE /monitors/<monitor-id>/heartbeatsDeletes every heartbeat for a monitor and resets its statistics.