---
title: Getting started
description: From signing up to a working monitor with alerts and a public status page, in about ten minutes.
sidebar:
label: Getting started
order: 1
---
This walks through the whole loop once: watch something, get told when it
breaks, and show your users. Roughly ten minutes.
## 1. Create your workspace
Sign up and you get a [workspace](/organization/workspaces) — the container for
your monitors, status pages, channels and billing. One is usually enough; use
[projects](/organization/projects) to organise inside it.
## 2. Create your first monitor
Start with the thing your users would notice first — your site or your API.
1. **Pick the type**
Choose [HTTP(S)](/monitors/http) and enter the URL. A health endpoint that
touches your database is a much better target than your homepage: it fails
when your service is genuinely broken, not just when the CDN hiccups.
2. **Set the interval**
60 seconds is a sensible default. Faster intervals detect sooner and cost
more checks; see [Plans and limits](/billing/plans) for what your plan
allows.
3. **Leave the confirmation defaults alone**
Two failures to go down, two successes to recover, and a 30-second floor on
how long the failure must last. These exist so a single dropped packet does
not page you — see
[Confirmations and flapping](/monitors/confirmations).
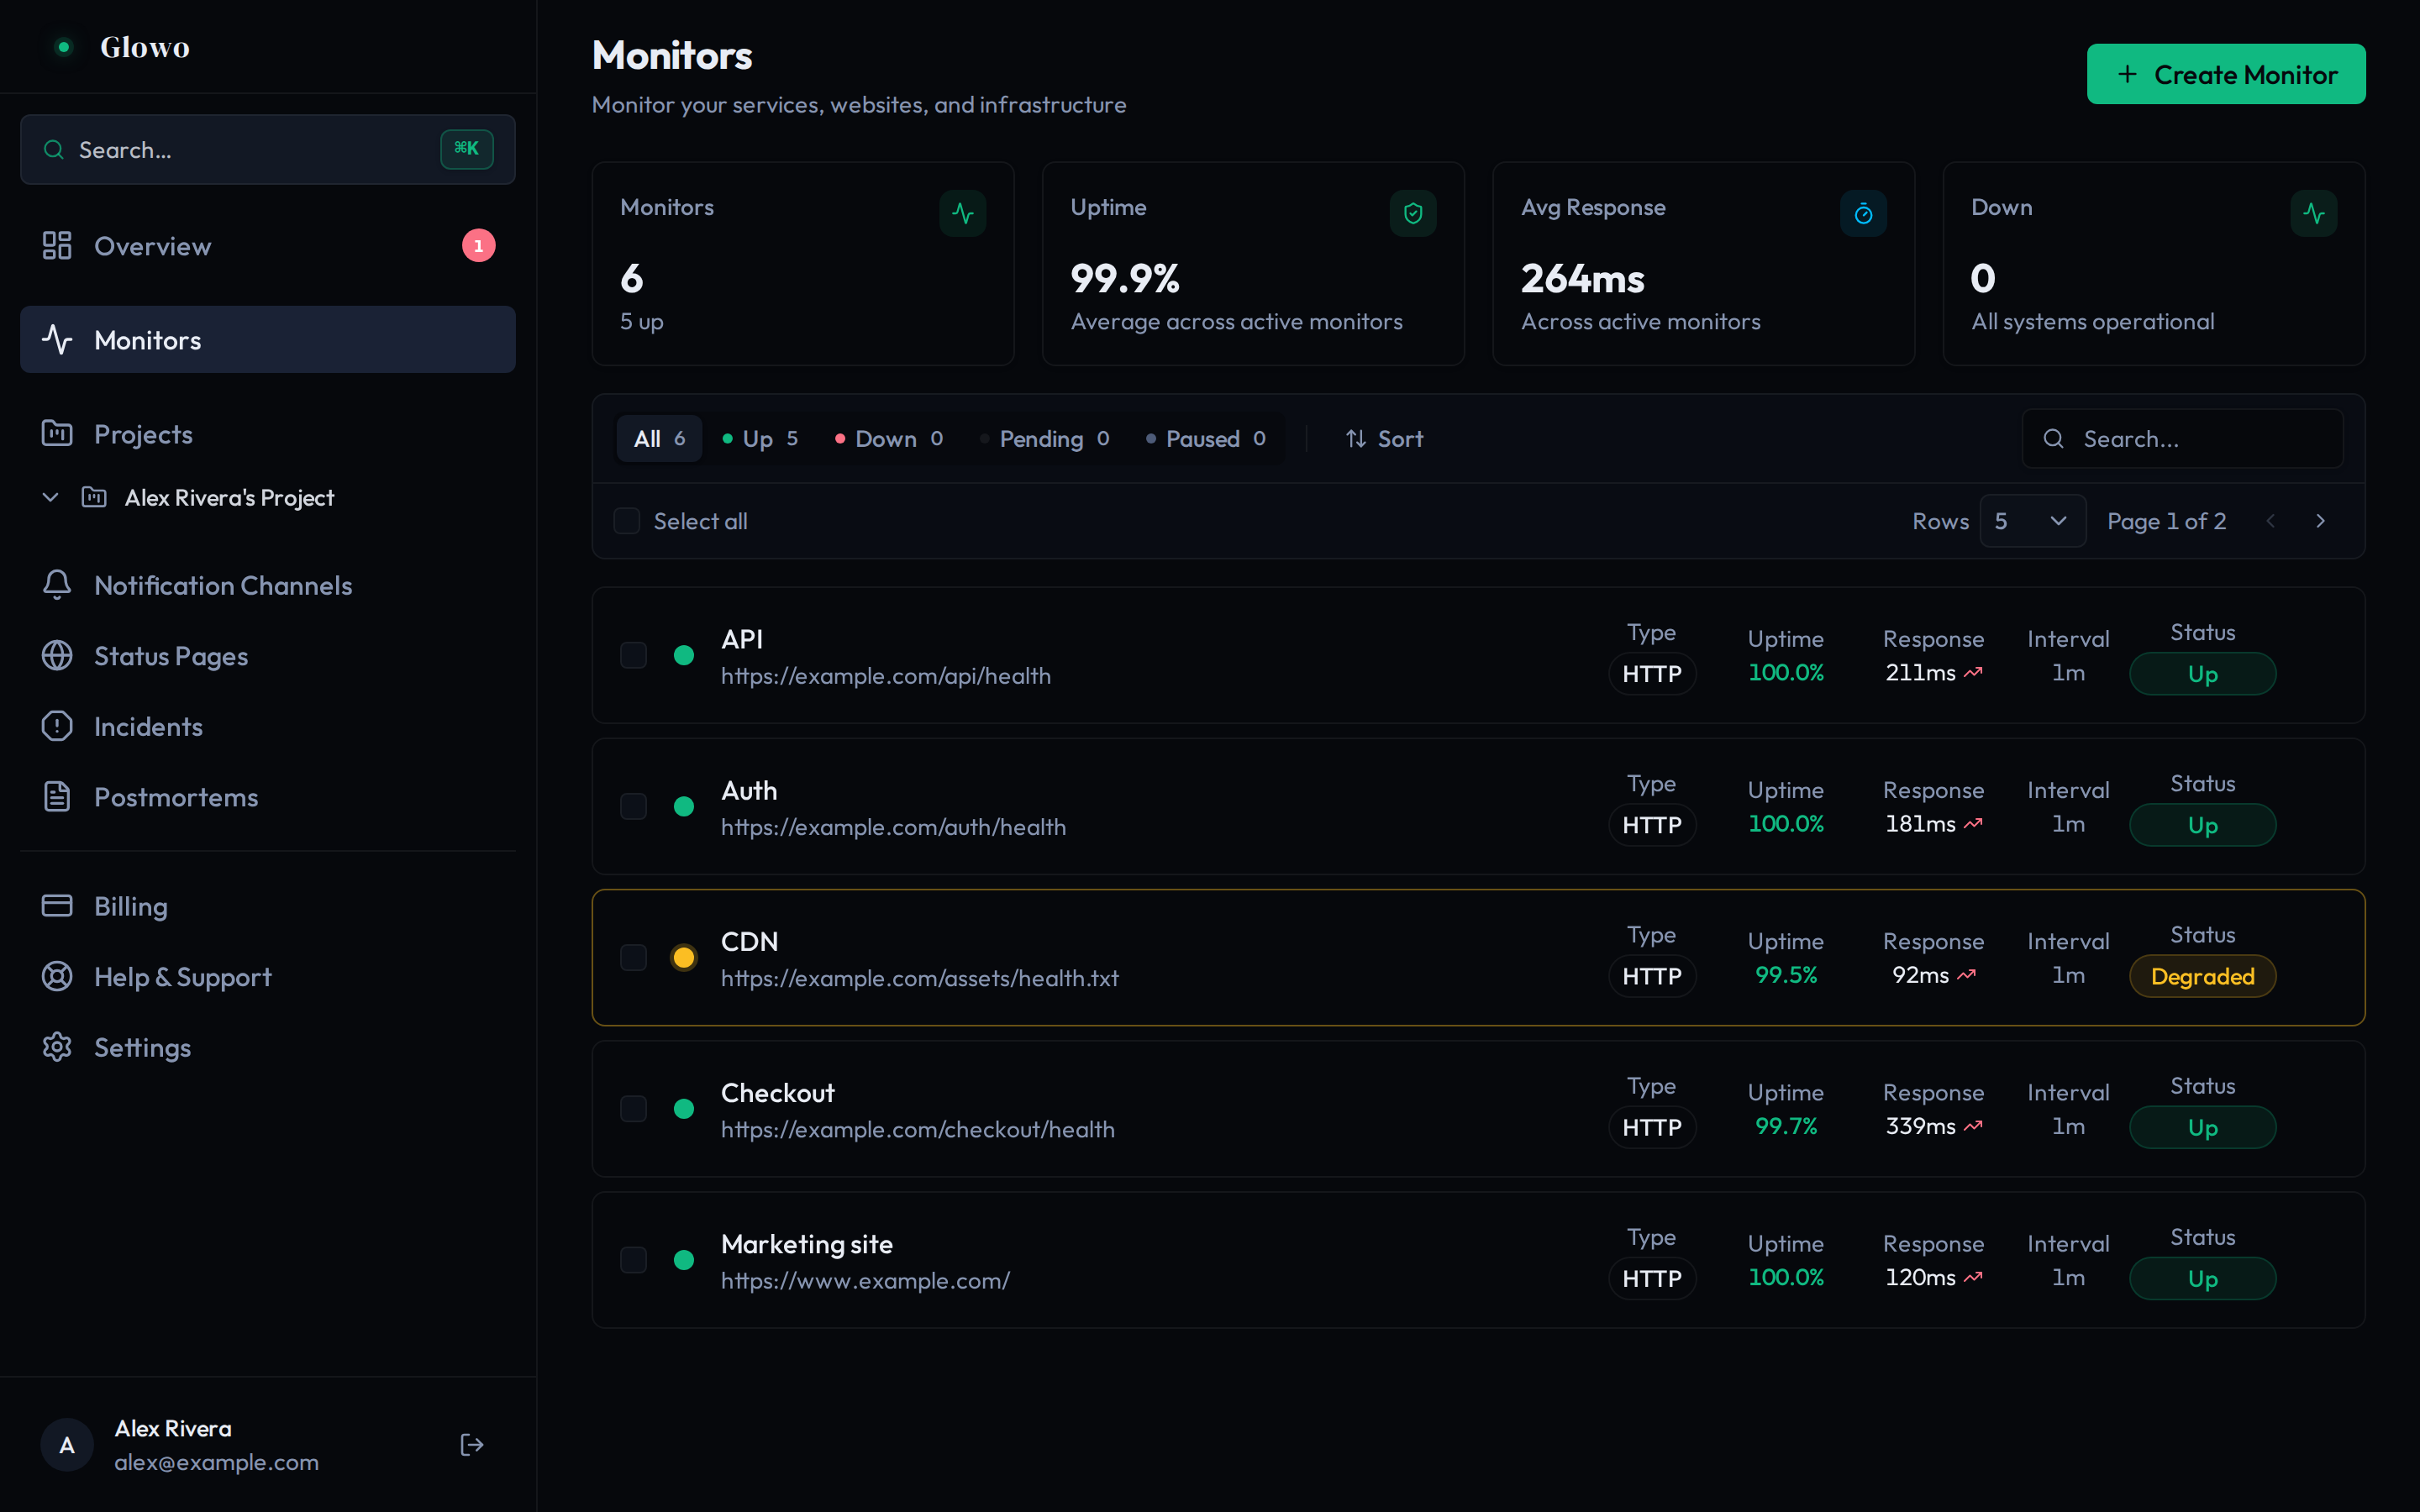
4. **Save and watch**
The monitor starts `PENDING` and moves to `UP` after its first check.
## 3. Make it check something real
A 200 response does not mean your service works. Add an
[assertion](/monitors/assertions) so the check fails when the *service* fails:
| Field | Value |
| --- | --- |
| source | `json_body` |
| property | `status` |
| comparison | `equals` |
| target | `ok` |
| severity | `fail` |
This is the step most people skip, and the one that decides whether your
monitoring is worth having.
## 4. Set up alerts
A monitor with no [channel](/alerting/channels) attached tells nobody anything.
1. **Create a channel**
[Email](/alerting/email) is the quickest start.
[Slack](/alerting/slack) or [Discord](/alerting/discord) suit a team.
2. **Subscribe to both DOWN and UP**
Subscribing only to `MONITOR_DOWN` means nobody ever learns the incident
ended. This is the most common mistake on this page.
3. **Attach it to the monitor**
Either directly, or — better — scope the channel to a
[project](/organization/projects) so monitors added later are covered
automatically.
4. **Send a test**
Use the **Test** action. A typo'd webhook URL is completely silent until
your first real outage.
## 5. Publish a status page
1. **Create the page**
Give it a name and a slug.
2. **Add components**
Expose only what a customer can perceive, named the way they would name it —
"API", not `prod-api-lb-health`. See
[Components and groups](/status-pages/components).
3. **Publish**
Until then, share it with a
[preview link](/status-pages/publishing).
Then tell people it exists — footer, help centre, support auto-responder. A
status page nobody knows about does not reduce support load.
## 6. Watch your cron jobs too
Scheduled work fails silently, because there is nothing to poll. A
[push monitor](/monitors/push) inverts the check — your job calls Glowo, and you
are alerted when it does not:
The `&&` matters. A heartbeat that fires regardless of the exit code reports
success while the job is failing.
## Where to go next
TCP, ping, DNS, WebSocket, gRPC and heartbeat checks.
The settings that decide when a failure becomes an alert.
Tell a real outage apart from one bad network path.
Let Claude or Cursor investigate and operate your monitoring.
## A checklist worth doing once
- [ ] Every critical monitor has an assertion, not just a status check.
- [ ] Every channel is subscribed to `MONITOR_UP` as well as `MONITOR_DOWN`.
- [ ] You have sent a test through every channel.
- [ ] Critical monitors check from more than one region.
- [ ] Scheduled jobs have push monitors with a sensible grace period.
- [ ] Your status page is linked from somewhere users will find it.